Comparing Two or More Groups
Festinger and Carlsmith’s (1959) “Lie for a Dollar” study
For our first example, we will be using simulated data based on Festinger and Carlsmith’s (1959) "lie for a dollar" study. In their study, participants did a series of incredibly boring tasks for an hour. In the "One Dollar" condition, participants were then asked to lie to the next participant, telling them that the task was fun. For doing this, they would be paid $1. The "Twenty Dollar" condition was the same as the "One Dollar" condition except that participants were paid $20 for lying. Finally, there was a control condition in which participants didn’t lie to anyone. All subjects were contacted later and asked how enjoyable the tasks were on a scale from -5 to +5. This was the dependent variable.
Festinger and Carlsmith hypothesized that when people lie and don’t have a good reason to lie (such as being paid only one measly dollar), they will be motivated to believe the lie. In this case, the One Dollar group should be motivated to believe that the experiment was enjoyable. The Twenty Dollar group also lied, but they had a much better reason (they were paid $20), and the control group didn’t lie at all. Those two groups should have no reason to think the tasks were enjoyable. Thus, Festinger and Carlsmith predicted that the One Dollar condition should believe the tasks were more enjoyable than either the Twenty Dollar condition or the control condition. You can download the Excel file here:
Step 1: Plot Your Data!
Check the distribution with a boxplot
Using the plotting skills you learned in the last statistics exercise, check the distribution of the data using a boxplot. You should get a plot that looks like this:
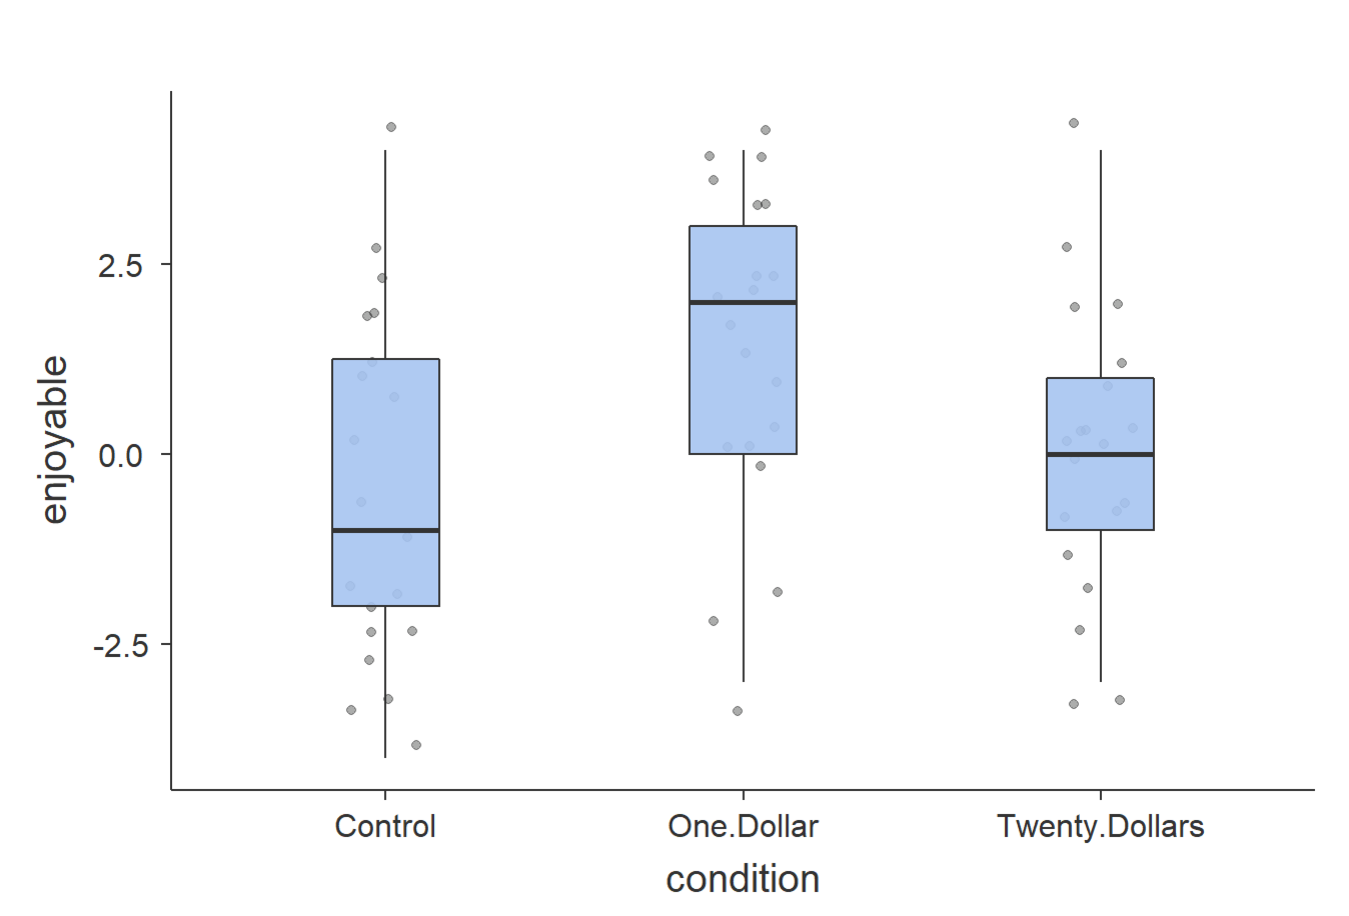
The inter-quartile range (the box in the middle of each boxplot) is slightly narrower in the twenty-dollars condition and slightly wider in the control condition, but in all three groups, the data seem to be approximately normal. There are no outliers (extreme scores) for any of the groups.