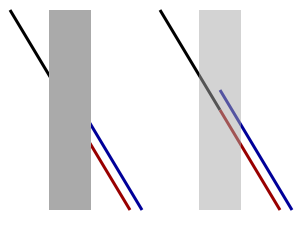
The Poggendorff Illusion is a classic illusion discovered by Johann Poggendorff and first published in the middle 19th century. It was discovered embedded in another illusion by Poggendorff as he was editing a paper presenting a different illusion, the Zöllner illusion. In the Poggendorff illusion, lines on the opposite side of bar do not look aligned when in fact they are. See the image below.
In this version of the experiment, you can try out several version. The main independent variable is angle, which has shown to be quite important in this illusion. So you can select several angles and see how this impacts the illusion.
You can adjust several parameters to design your own version of the experments. The settings are discussed below.
You can adjust several parameters to design your own version of the experments. The settings are discuss below.
Bar Width (rel total width): How wide is the bar that the line goes across.
The value is the width of the bar relative to the total width of the drawing area.
Bar Gray Level: You can control the gray shade of the bar from black (0)
to white (255).
Background Gray Level : the brightness of the background, in basic display units.
Line Gray Level : the brightness of the line.
Fixation Duration(ms): how long the fixation mark is on (ms).
Stimulus Delay (ms from end of fixation): how long after the fixation mark is removed
till the beginning of the stimulus. This number needs to be big enough for any arrows that occur before
the stimulus (the negative numbrer includes the duration of the stimulus).
Reset Stimulus At the top of the settings is a Reset Stimulus button.
Pressing this button restores the method settings to their default values.
Number of Angles to Test.: this is the principle independent variable during the
experiment. This is the angle between the line and horizontal (0 deg). You can test from 1 to
5 angles during an experiment. The order will be randomly selected.
Smallest Angle: This selects the smallest angle to be tested or if
only one condition is tested, this will be the angle tested.
Greatest Angle: This is the greatest angle to be tested if more than one
condition is tested. Other angles selected will fall between these two end values in even steps.
Number of Trials/Condition: how many trials at each level of angle.
Reset Method At the top of the settings page is a Reset Method button.
Pressing this button restores the stimulus settings to their default values.
Change the settings below to alter the stimulus parameters in this experiment.
Change the settings below to alter the parameters of the experimental method.
Below, press the spacebar or the Open Experiment Window button on the screen to open the window where the experiment will run. When this screen opens, press the spacebar or click the "Start" button to begin the experiment. There are instructions above the "Start" button. Read them to know how to perform the experiment. Keep your eyes fixated on the red plus sign in the middle of the screen.
Your data will be presented on the results tab. The x-axis will have angles tested. The y-axis will show the error between a perfect line and the line you chose. A value of 0 means that you perfectly lined up the two ends. To download your trial-by-trial, press the Show Data link. To download the summary data press the Show Summary link. This data will be stored in a csv format readable by most spreadsheet and statistical programs.